

> # Load the dplyr package
> library(dplyr)
>
> # Load the hflights package
> library(hflights)
>
> # Call both head() and summary() on hflights
> head(hflights)
     Year Month DayofMonth DayOfWeek DepTime ArrTime UniqueCarrier FlightNum
5424 2011     1          1         6    1400    1500            AA       428
5425 2011     1          2         7    1401    1501            AA       428
5426 2011     1          3         1    1352    1502            AA       428
5427 2011     1          4         2    1403    1513            AA       428
5428 2011     1          5         3    1405    1507            AA       428
5429 2011     1          6         4    1359    1503            AA       428
     TailNum ActualElapsedTime AirTime ArrDelay DepDelay Origin Dest Distance
5424  N576AA                60      40      -10        0    IAH  DFW      224
5425  N557AA                60      45       -9        1    IAH  DFW      224
5426  N541AA                70      48       -8       -8    IAH  DFW      224
5427  N403AA                70      39        3        3    IAH  DFW      224
5428  N492AA                62      44       -3        5    IAH  DFW      224
5429  N262AA                64      45       -7       -1    IAH  DFW      224
     TaxiIn TaxiOut Cancelled CancellationCode Diverted
5424      7      13         0                         0
5425      6       9         0                         0
5426      5      17         0                         0
5427      9      22         0                         0
5428      9       9         0                         0
5429      6      13         0                         0
> summary(hflights)
      Year          Month          DayofMonth      DayOfWeek        DepTime
 Min.   :2011   Min.   : 1.000   Min.   : 1.00   Min.   :1.000   Min.   :   1
 1st Qu.:2011   1st Qu.: 4.000   1st Qu.: 8.00   1st Qu.:2.000   1st Qu.:1021
 Median :2011   Median : 7.000   Median :16.00   Median :4.000   Median :1416
 Mean   :2011   Mean   : 6.514   Mean   :15.74   Mean   :3.948   Mean   :1396
 3rd Qu.:2011   3rd Qu.: 9.000   3rd Qu.:23.00   3rd Qu.:6.000   3rd Qu.:1801
 Max.   :2011   Max.   :12.000   Max.   :31.00   Max.   :7.000   Max.   :2400
                                                                 NA's   :2905
    ArrTime     UniqueCarrier        FlightNum      TailNum
 Min.   :   1   Length:227496      Min.   :   1   Length:227496
 1st Qu.:1215   Class :character   1st Qu.: 855   Class :character
 Median :1617   Mode  :character   Median :1696   Mode  :character
 Mean   :1578                      Mean   :1962
 3rd Qu.:1953                      3rd Qu.:2755
 Max.   :2400                      Max.   :7290
 NA's   :3066
 ActualElapsedTime    AirTime         ArrDelay          DepDelay
 Min.   : 34.0     Min.   : 11.0   Min.   :-70.000   Min.   :-33.000
 1st Qu.: 77.0     1st Qu.: 58.0   1st Qu.: -8.000   1st Qu.: -3.000
 Median :128.0     Median :107.0   Median :  0.000   Median :  0.000
 Mean   :129.3     Mean   :108.1   Mean   :  7.094   Mean   :  9.445
 3rd Qu.:165.0     3rd Qu.:141.0   3rd Qu.: 11.000   3rd Qu.:  9.000
 Max.   :575.0     Max.   :549.0   Max.   :978.000   Max.   :981.000
 NA's   :3622      NA's   :3622    NA's   :3622      NA's   :2905
    Origin              Dest              Distance          TaxiIn
 Length:227496      Length:227496      Min.   :  79.0   Min.   :  1.000
 Class :character   Class :character   1st Qu.: 376.0   1st Qu.:  4.000
 Mode  :character   Mode  :character   Median : 809.0   Median :  5.000
                                       Mean   : 787.8   Mean   :  6.099
                                       3rd Qu.:1042.0   3rd Qu.:  7.000
                                       Max.   :3904.0   Max.   :165.000
                                                        NA's   :3066
    TaxiOut         Cancelled       CancellationCode      Diverted
 Min.   :  1.00   Min.   :0.00000   Length:227496      Min.   :0.000000
 1st Qu.: 10.00   1st Qu.:0.00000   Class :character   1st Qu.:0.000000
 Median : 14.00   Median :0.00000   Mode  :character   Median :0.000000
 Mean   : 15.09   Mean   :0.01307                      Mean   :0.002853
 3rd Qu.: 18.00   3rd Qu.:0.00000                      3rd Qu.:0.000000
 Max.   :163.00   Max.   :1.00000                      Max.   :1.000000
 NA's   :2947
> # Both the dplyr and hflights packages are loaded
>
> # Convert the hflights data.frame into a hflights tbl
> hflights = tbl_df(hflights)
>
> # Display the hflights tbl
> hflights
Source: local data frame [22,751 x 21]

   Year Month DayofMonth DayOfWeek DepTime ArrTime UniqueCarrier FlightNum
1  2011    11         20         7    1840    2127            FL       296
2  2011    10          2         7    1733    1825            XE      4594
3  2011     8         20         6    1540    1630            CO        35
4  2011     9         22         4    1536    1827            XE      2122
5  2011     8          7         7    2130    2228            OO      5839
6  2011     4         30         6     744     837            WN      1493
7  2011     4          5         2    1621    1812            XE      2346
8  2011    12         29         4     832     953            WN       683
9  2011     1         28         5    1218    1337            CO      1629
10 2011     7         12         2    1603    1657            WN        40
..  ...   ...        ...       ...     ...     ...           ...       ...
Variables not shown: TailNum (chr), ActualElapsedTime (int), AirTime (int),
  ArrDelay (int), DepDelay (int), Origin (chr), Dest (chr), Distance (int),
  TaxiIn (int), TaxiOut (int), Cancelled (int), CancellationCode (chr),
  Diverted (int)
>
> # Create the object carriers, containing only the UniqueCarrier variable of hflights
> carriers = hflights$UniqueCarrier
~~~


~~~r
> # Both the dplyr and hflights packages are loaded into workspace
> lut <- c("AA" = "American", "AS" = "Alaska", "B6" = "JetBlue", "CO" = "Continental",
         "DL" = "Delta", "OO" = "SkyWest", "UA" = "United", "US" = "US_Airways",
         "WN" = "Southwest", "EV" = "Atlantic_Southeast", "F9" = "Frontier",
         "FL" = "AirTran", "MQ" = "American_Eagle", "XE" = "ExpressJet", "YV" = "Mesa")
>
> # Use lut to translate the UniqueCarrier column of hflights
> hflights$UniqueCarrier = lut[hflights$UniqueCarrier]
>
> # Inspect the resulting raw values of your variables
> glimpse(hflights)
Observations: 22751
Variables:
$ Year              (int) 2011, 2011, 2011, 2011, 2011, 2011, 2011, 2011, 2...
$ Month             (int) 11, 10, 8, 9, 8, 4, 4, 12, 1, 7, 3, 11, 10, 12, 1...
$ DayofMonth        (int) 20, 2, 20, 22, 7, 30, 5, 29, 28, 12, 8, 27, 28, 2...
$ DayOfWeek         (int) 7, 7, 6, 4, 7, 6, 2, 4, 5, 2, 2, 7, 5, 3, 1, 4, 7...
$ DepTime           (int) 1840, 1733, 1540, 1536, 2130, 744, 1621, 832, 121...
$ ArrTime           (int) 2127, 1825, 1630, 1827, 2228, 837, 1812, 953, 133...
$ UniqueCarrier     (chr) "AirTran", "ExpressJet", "Continental", "ExpressJ...
$ FlightNum         (int) 296, 4594, 35, 2122, 5839, 1493, 2346, 683, 1629,...
$ TailNum           (chr) "N329AT", "N15941", "N16646", "N14125", "N952SW",...
$ ActualElapsedTime (int) 107, 52, 50, 171, 58, 53, 111, 201, 199, 54, 178,...
$ AirTime           (int) 88, 38, 27, 140, 40, 43, 89, 186, 177, 41, 156, 4...
$ ArrDelay          (int) -8, -8, 4, 3, -15, -8, 25, -17, -30, -3, 9, 13, 9...
$ DepDelay          (int) -4, -3, 0, 1, 0, -1, 16, 7, -2, 3, 8, 11, -6, 2, ...
$ Origin            (chr) "HOU", "IAH", "IAH", "IAH", "IAH", "HOU", "IAH", ...
$ Dest              (chr) "ATL", "CRP", "AUS", "MSP", "DFW", "MSY", "HSV", ...
$ Distance          (int) 696, 201, 140, 1034, 224, 303, 595, 1390, 1347, 2...
$ TaxiIn            (int) 11, 3, 6, 12, 4, 3, 4, 7, 7, 4, 7, 4, 5, 9, 3, NA...
$ TaxiOut           (int) 8, 11, 17, 19, 14, 7, 18, 8, 15, 9, 15, 11, 25, 1...
$ Cancelled         (int) 0, 0, 0, 0, 0, 0, 0, 0, 0, 0, 0, 0, 0, 0, 0, 1, 0...
$ CancellationCode  (chr) "", "", "", "", "", "", "", "", "", "", "", "", "...
$ Diverted          (int) 0, 0, 0, 0, 0, 0, 0, 0, 0, 0, 0, 0, 0, 0, 0, 0, 0...
>
> # The hflights tbl you built in the previous exercise is available in the workspace.
>
> # Build the lookup table: lut
> lut= c("A"= "carrier",
        "B" = "weather",
        "C" = "FFA",
        "D" = "security",
        "E" = "not cancelled")
> # Use the lookup table to create a vector of code labels. Assign the vector to the CancellationCode column of hflights
> hflights$CancellationCode = lut[hflights$CancellationCode]
>
>
> # Inspect the resulting raw values of your variables
> glimpse(hflights)
Observations: 22751
Variables:
$ Year              (int) 2011, 2011, 2011, 2011, 2011, 2011, 2011, 2011, 2...
$ Month             (int) 11, 10, 8, 9, 8, 4, 4, 12, 1, 7, 3, 11, 10, 12, 1...
$ DayofMonth        (int) 20, 2, 20, 22, 7, 30, 5, 29, 28, 12, 8, 27, 28, 2...
$ DayOfWeek         (int) 7, 7, 6, 4, 7, 6, 2, 4, 5, 2, 2, 7, 5, 3, 1, 4, 7...
$ DepTime           (int) 1840, 1733, 1540, 1536, 2130, 744, 1621, 832, 121...
$ ArrTime           (int) 2127, 1825, 1630, 1827, 2228, 837, 1812, 953, 133...
$ UniqueCarrier     (chr) "AirTran", "ExpressJet", "Continental", "ExpressJ...
$ FlightNum         (int) 296, 4594, 35, 2122, 5839, 1493, 2346, 683, 1629,...
$ TailNum           (chr) "N329AT", "N15941", "N16646", "N14125", "N952SW",...
$ ActualElapsedTime (int) 107, 52, 50, 171, 58, 53, 111, 201, 199, 54, 178,...
$ AirTime           (int) 88, 38, 27, 140, 40, 43, 89, 186, 177, 41, 156, 4...
$ ArrDelay          (int) -8, -8, 4, 3, -15, -8, 25, -17, -30, -3, 9, 13, 9...
$ DepDelay          (int) -4, -3, 0, 1, 0, -1, 16, 7, -2, 3, 8, 11, -6, 2, ...
$ Origin            (chr) "HOU", "IAH", "IAH", "IAH", "IAH", "HOU", "IAH", ...
$ Dest              (chr) "ATL", "CRP", "AUS", "MSP", "DFW", "MSY", "HSV", ...
$ Distance          (int) 696, 201, 140, 1034, 224, 303, 595, 1390, 1347, 2...
$ TaxiIn            (int) 11, 3, 6, 12, 4, 3, 4, 7, 7, 4, 7, 4, 5, 9, 3, NA...
$ TaxiOut           (int) 8, 11, 17, 19, 14, 7, 18, 8, 15, 9, 15, 11, 25, 1...
$ Cancelled         (int) 0, 0, 0, 0, 0, 0, 0, 0, 0, 0, 0, 0, 0, 0, 0, 1, 0...
$ CancellationCode  (chr) "not cancelled", "not cancelled", "not cancelled"...
$ Diverted          (int) 0, 0, 0, 0, 0, 0, 0, 0, 0, 0, 0, 0, 0, 0, 0, 0, 0...
>
> # hflights is pre-loaded as a tbl, together with the necessary libraries.
>
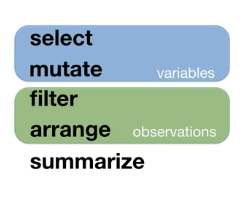
> # Print out a tbl with the four columns of hflights related to delay
> select(hflights, ActualElapsedTime, AirTime, ArrDelay, DepDelay)
Source: local data frame [22,751 x 4]
ActualElapsedTime AirTime ArrDelay DepDelay
1 107 88 -8 -4
2 52 38 -8 -3
3 50 27 4 0
4 171 140 3 1
5 58 40 -15 0
6 53 43 -8 -1
7 111 89 25 16
8 201 186 -17 7
9 199 177 -30 -2
10 54 41 -3 3
.. ... ... ... ...
>
> # Print out hflights, nothing has changed!
> hflights
Source: local data frame [22,751 x 21]
Year Month DayofMonth DayOfWeek DepTime ArrTime UniqueCarrier FlightNum
1 2011 11 20 7 1840 2127 FL 296
2 2011 10 2 7 1733 1825 XE 4594
3 2011 8 20 6 1540 1630 CO 35
4 2011 9 22 4 1536 1827 XE 2122
5 2011 8 7 7 2130 2228 OO 5839
6 2011 4 30 6 744 837 WN 1493
7 2011 4 5 2 1621 1812 XE 2346
8 2011 12 29 4 832 953 WN 683
9 2011 1 28 5 1218 1337 CO 1629
10 2011 7 12 2 1603 1657 WN 40
.. ... ... ... ... ... ... ... ...
Variables not shown: TailNum (chr), ActualElapsedTime (int), AirTime (int),
ArrDelay (int), DepDelay (int), Origin (chr), Dest (chr), Distance (int),
TaxiIn (int), TaxiOut (int), Cancelled (int), CancellationCode (chr),
Diverted (int)
>
> # Print out the columns Origin up to Cancelled of hflights
> select(hflights, Origin:Cancelled)
Source: local data frame [22,751 x 6]
Origin Dest Distance TaxiIn TaxiOut Cancelled
1 HOU ATL 696 11 8 0
2 IAH CRP 201 3 11 0
3 IAH AUS 140 6 17 0
4 IAH MSP 1034 12 19 0
5 IAH DFW 224 4 14 0
6 HOU MSY 303 3 7 0
7 IAH HSV 595 4 18 0
8 HOU LAX 1390 7 8 0
9 IAH SNA 1347 7 15 0
10 HOU DAL 239 4 9 0
.. ... ... ... ... ... ...
>
> # Answer to last question: be concise!
> select(hflights, -DepTime, -ArrTime, -UniqueCarrier, -FlightNum, -TailNum, -ActualElapsedTime, -AirTime)
Source: local data frame [22,751 x 14]
Year Month DayofMonth DayOfWeek ArrDelay DepDelay Origin Dest Distance
1 2011 11 20 7 -8 -4 HOU ATL 696
2 2011 10 2 7 -8 -3 IAH CRP 201
3 2011 8 20 6 4 0 IAH AUS 140
4 2011 9 22 4 3 1 IAH MSP 1034
5 2011 8 7 7 -15 0 IAH DFW 224
6 2011 4 30 6 -8 -1 HOU MSY 303
7 2011 4 5 2 25 16 IAH HSV 595
8 2011 12 29 4 -17 7 HOU LAX 1390
9 2011 1 28 5 -30 -2 IAH SNA 1347
10 2011 7 12 2 -3 3 HOU DAL 239
.. ... ... ... ... ... ... ... ... ...
Variables not shown: TaxiIn (int), TaxiOut (int), Cancelled (int),
CancellationCode (chr), Diverted (int)
>
> # As usual, hflights is pre-loaded as a tbl, together with the necessary libraries.
>
> # Print out a tbl containing just ArrDelay and DepDelay
> select(hflights, contains("Delay"))
Source: local data frame [22,751 x 2]

   ArrDelay DepDelay
1        -8       -4
2        -8       -3
3         4        0
4         3        1
5       -15        0
6        -8       -1
7        25       16
8       -17        7
9       -30       -2
10       -3        3
..      ...      ...
>
> # Print out a tbl as described in the second instruction, using both helper functions and variable names
> select(hflights, starts_with("Unique"), contains("Num"), contains("Cancel"))
Source: local data frame [22,751 x 5]

   UniqueCarrier FlightNum TailNum Cancelled CancellationCode
1             FL       296  N329AT         0
2             XE      4594  N15941         0
3             CO        35  N16646         0
4             XE      2122  N14125         0
5             OO      5839  N952SW         0
6             WN      1493  N785SW         0
7             XE      2346  N13994         0
8             WN       683  N415WN         0
9             CO      1629  N15710         0
10            WN        40  N614SW         0
..           ...       ...     ...       ...              ...
>
> # Print out a tbl as described in the third instruction, using only helper functions.
> select(hflights,contains("Time"), contains("Delay"))
Source: local data frame [22,751 x 6]

   DepTime ArrTime ActualElapsedTime AirTime ArrDelay DepDelay
1     1840    2127               107      88       -8       -4
2     1733    1825                52      38       -8       -3
3     1540    1630                50      27        4        0
4     1536    1827               171     140        3        1
5     2130    2228                58      40      -15        0
6      744     837                53      43       -8       -1
7     1621    1812               111      89       25       16
8      832     953               201     186      -17        7
9     1218    1337               199     177      -30       -2
10    1603    1657                54      41       -3        3
..     ...     ...               ...     ...      ...      ...
>
> # both hflights and dplyr are available
>
> ex1r <- hflights[c("TaxiIn","TaxiOut","Distance")]
> ex1d <- select(hflights, TaxiIn, TaxiOut, Distance)
> ex1r
Source: local data frame [22,751 x 3]

   TaxiIn TaxiOut Distance
1      11       8      696
2       3      11      201
3       6      17      140
4      12      19     1034
5       4      14      224
6       3       7      303
7       4      18      595
8       7       8     1390
9       7      15     1347
10      4       9      239
..    ...     ...      ...
> ex1d
Source: local data frame [22,751 x 3]

   TaxiIn TaxiOut Distance
1      11       8      696
2       3      11      201
3       6      17      140
4      12      19     1034
5       4      14      224
6       3       7      303
7       4      18      595
8       7       8     1390
9       7      15     1347
10      4       9      239
..    ...     ...      ...
>
> ex2r <- hflights[c("Year","Month","DayOfWeek","DepTime","ArrTime")]
> ex2d <- select(hflights, Year, Month, DayOfWeek, DepTime, ArrTime)
> ex2r
Source: local data frame [22,751 x 5]

   Year Month DayOfWeek DepTime ArrTime
1  2011    11         7    1840    2127
2  2011    10         7    1733    1825
3  2011     8         6    1540    1630
4  2011     9         4    1536    1827
5  2011     8         7    2130    2228
6  2011     4         6     744     837
7  2011     4         2    1621    1812
8  2011    12         4     832     953
9  2011     1         5    1218    1337
10 2011     7         2    1603    1657
..  ...   ...       ...     ...     ...
> ex2d
Source: local data frame [22,751 x 5]

   Year Month DayOfWeek DepTime ArrTime
1  2011    11         7    1840    2127
2  2011    10         7    1733    1825
3  2011     8         6    1540    1630
4  2011     9         4    1536    1827
5  2011     8         7    2130    2228
6  2011     4         6     744     837
7  2011     4         2    1621    1812
8  2011    12         4     832     953
9  2011     1         5    1218    1337
10 2011     7         2    1603    1657
..  ...   ...       ...     ...     ...
>
> ex3r <- hflights[c("TailNum","TaxiIn","TaxiOut")]
> ex3d <- select(hflights, TailNum, TaxiIn, TaxiOut)
> ex3r
Source: local data frame [22,751 x 3]

   TailNum TaxiIn TaxiOut
1   N329AT     11       8
2   N15941      3      11
3   N16646      6      17
4   N14125     12      19
5   N952SW      4      14
6   N785SW      3       7
7   N13994      4      18
8   N415WN      7       8
9   N15710      7      15
10  N614SW      4       9
..     ...    ...     ...
> ex3d
Source: local data frame [22,751 x 3]

   TailNum TaxiIn TaxiOut
1   N329AT     11       8
2   N15941      3      11
3   N16646      6      17
4   N14125     12      19
5   N952SW      4      14
6   N785SW      3       7
7   N13994      4      18
8   N415WN      7       8
9   N15710      7      15
10  N614SW      4       9
..     ...    ...     ...
>
> # hflights and dplyr are loaded and ready to serve you.
>
> # Add the new variable ActualGroundTime to a copy of hflights and save the result as g1.
> g1 = mutate(hflights, ActualGroundTime = ActualElapsedTime - AirTime)
> g1
Source: local data frame [22,751 x 22]

   Year Month DayofMonth DayOfWeek DepTime ArrTime UniqueCarrier FlightNum
1  2011    11         20         7    1840    2127            FL       296
2  2011    10          2         7    1733    1825            XE      4594
3  2011     8         20         6    1540    1630            CO        35
4  2011     9         22         4    1536    1827            XE      2122
5  2011     8          7         7    2130    2228            OO      5839
6  2011     4         30         6     744     837            WN      1493
7  2011     4          5         2    1621    1812            XE      2346
8  2011    12         29         4     832     953            WN       683
9  2011     1         28         5    1218    1337            CO      1629
10 2011     7         12         2    1603    1657            WN        40
..  ...   ...        ...       ...     ...     ...           ...       ...
Variables not shown: TailNum (chr), ActualElapsedTime (int), AirTime (int),
  ArrDelay (int), DepDelay (int), Origin (chr), Dest (chr), Distance (int),
  TaxiIn (int), TaxiOut (int), Cancelled (int), CancellationCode (chr),
  Diverted (int), ActualGroundTime (int)

> select(g1, ActualElapsedTime, AirTime, ActualGroundTime)
Source: local data frame [22,751 x 3]

   ActualElapsedTime AirTime ActualGroundTime
1                107      88               19
2                 52      38               14
3                 50      27               23
4                171     140               31
5                 58      40               18
6                 53      43               10
7                111      89               22
8                201     186               15
9                199     177               22
10                54      41               13
..               ...     ...              ...
>
> # Add the new variable GroundTime to a g1. Save the result as g2.
> g2 = mutate(g1, GroundTime = TaxiIn + TaxiOut)
> select(g2, TaxiIn, TaxiOut, GroundTime)
Source: local data frame [22,751 x 3]

   TaxiIn TaxiOut GroundTime
1      11       8         19
2       3      11         14
3       6      17         23
4      12      19         31
5       4      14         18
6       3       7         10
7       4      18         22
8       7       8         15
9       7      15         22
10      4       9         13
..    ...     ...        ...
>
> # Add the new variable AverageSpeed to g2. Save the result as g3.
> g3 = mutate(g2, AverageSpeed = Distance / AirTime * 60)
> select(g3, Distance, AirTime, AverageSpeed)
Source: local data frame [22,751 x 3]

   Distance AirTime AverageSpeed
1       696      88     474.5455
2       201      38     317.3684
3       140      27     311.1111
4      1034     140     443.1429
5       224      40     336.0000
6       303      43     422.7907
7       595      89     401.1236
8      1390     186     448.3871
9      1347     177     456.6102
10      239      41     349.7561
..      ...     ...          ...
>
> # Print out g3
> g3
Source: local data frame [22,751 x 24]

   Year Month DayofMonth DayOfWeek DepTime ArrTime UniqueCarrier FlightNum
1  2011    11         20         7    1840    2127            FL       296
2  2011    10          2         7    1733    1825            XE      4594
3  2011     8         20         6    1540    1630            CO        35
4  2011     9         22         4    1536    1827            XE      2122
5  2011     8          7         7    2130    2228            OO      5839
6  2011     4         30         6     744     837            WN      1493
7  2011     4          5         2    1621    1812            XE      2346
8  2011    12         29         4     832     953            WN       683
9  2011     1         28         5    1218    1337            CO      1629
10 2011     7         12         2    1603    1657            WN        40
..  ...   ...        ...       ...     ...     ...           ...       ...
Variables not shown: TailNum (chr), ActualElapsedTime (int), AirTime (int),
  ArrDelay (int), DepDelay (int), Origin (chr), Dest (chr), Distance (int),
  TaxiIn (int), TaxiOut (int), Cancelled (int), CancellationCode (chr),
  Diverted (int), ActualGroundTime (int), GroundTime (int), AverageSpeed (dbl)
>
> # hflights and dplyr are ready, are you?
>
> # Add a second variable loss_percent to the dataset: m1
> m1 <- mutate(hflights, loss = ArrDelay - DepDelay, loss_percent = (ArrDelay- DepDelay)/DepDelay * 100)
> select(m1, ArrDelay, DepDelay, loss, loss_percent)
Source: local data frame [22,751 x 4]

   ArrDelay DepDelay loss loss_percent
1        -8       -4   -4     100.0000
2        -8       -3   -5     166.6667
3         4        0    4          Inf
4         3        1    2     200.0000
5       -15        0  -15         -Inf
6        -8       -1   -7     700.0000
7        25       16    9      56.2500
8       -17        7  -24    -342.8571
9       -30       -2  -28    1400.0000
10       -3        3   -6    -200.0000
..      ...      ...  ...          ...
>
> # Copy and adapt the previous command to reduce redendancy: m2
> m2 = mutate(m1, loss_percent = 100*loss/DepDelay )
> select(m2, ArrDelay, DepDelay, loss_percent)
Source: local data frame [22,751 x 3]

   ArrDelay DepDelay loss_percent
1        -8       -4     100.0000
2        -8       -3     166.6667
3         4        0          Inf
4         3        1     200.0000
5       -15        0         -Inf
6        -8       -1     700.0000
7        25       16      56.2500
8       -17        7    -342.8571
9       -30       -2    1400.0000
10       -3        3    -200.0000
..      ...      ...          ...
>
> # Add the three variables as described in the third instruction: m3
> m3 = mutate(hflights, TotalTaxi = TaxiIn + TaxiOut, ActualGroundTime = ActualElapsedTime -AirTime, Diff = TotalTaxi - ActualGroundTime)
> select(m3, TaxiIn, TaxiOut, TotalTaxi, ActualElapsedTime, AirTime, ActualGroundTime, Diff)
Source: local data frame [22,751 x 7]

   TaxiIn TaxiOut TotalTaxi ActualElapsedTime AirTime ActualGroundTime Diff
1      11       8        19               107      88               19    0
2       3      11        14                52      38               14    0
3       6      17        23                50      27               23    0
4      12      19        31               171     140               31    0
5       4      14        18                58      40               18    0
6       3       7        10                53      43               10    0
7       4      18        22               111      89               22    0
8       7       8        15               201     186               15    0
9       7      15        22               199     177               22    0
10      4       9        13                54      41               13    0
..    ...     ...       ...               ...     ...              ...  ...
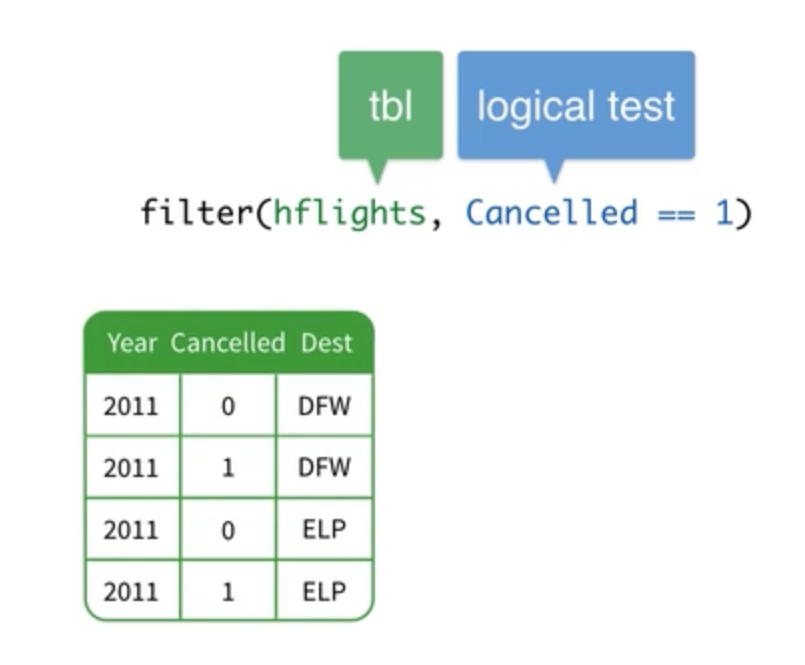
> # All flights that traveled 3000 miles or more
> filter(hflights, Distance > 3000)
Source: local data frame [62 x 21]

   Year Month DayofMonth DayOfWeek DepTime ArrTime UniqueCarrier FlightNum
1  2011    11         27         7     944    1357   Continental         1
2  2011     3          7         1     929    1348   Continental         1
3  2011     1         25         2     924    1337   Continental         1
4  2011    12         24         6     937    1410   Continental         1
5  2011     4         26         2     934    1249   Continental         1
6  2011    11         30         3     940    1407   Continental         1
7  2011     9         26         1     951    1250   Continental         1
8  2011     3         31         4    1013    1304   Continental         1
9  2011     4          8         5     940    1307   Continental         1
10 2011     5         12         4    1511    1902   Continental       407
..  ...   ...        ...       ...     ...     ...           ...       ...
Variables not shown: TailNum (chr), ActualElapsedTime (int), AirTime (int),
  ArrDelay (int), DepDelay (int), Origin (chr), Dest (chr), Distance (int),
  TaxiIn (int), TaxiOut (int), Cancelled (int), CancellationCode (chr),
  Diverted (int)
>
> # All flights flown by one of JetBlue, Southwest, or Delta
> filter(hflights, UniqueCarrier == "JetBlue" | UniqueCarrier == "Southwest" | UniqueCarrier == "Delta")
Source: local data frame [4,885 x 21]

   Year Month DayofMonth DayOfWeek DepTime ArrTime UniqueCarrier FlightNum
1  2011     4         30         6     744     837     Southwest      1493
2  2011    12         29         4     832     953     Southwest       683
3  2011     7         12         2    1603    1657     Southwest        40
4  2011    11         27         7    1621    1723     Southwest        33
5  2011     6          5         7     954    1309     Southwest         7
6  2011     6         24         5    1415    1503     Southwest        32
7  2011     2         26         6    1538    1951       JetBlue       624
8  2011    11         27         7    1603    1908         Delta      1846
9  2011    10          9         7    1232    1423     Southwest      2492
10 2011    12         30         5    1944    2045     Southwest      3499
..  ...   ...        ...       ...     ...     ...           ...       ...
Variables not shown: TailNum (chr), ActualElapsedTime (int), AirTime (int),
  ArrDelay (int), DepDelay (int), Origin (chr), Dest (chr), Distance (int),
  TaxiIn (int), TaxiOut (int), Cancelled (int), CancellationCode (chr),
  Diverted (int)
>
> # All flights where taxiing took longer than flying
> filter(hflights, TaxiIn + TaxiOut > AirTime)
Source: local data frame [145 x 21]

   Year Month DayofMonth DayOfWeek DepTime ArrTime UniqueCarrier FlightNum
1  2011     7          8         5    1248    1348   Continental      1467
2  2011     8         14         7    1751    1913   Continental      1779
3  2011    10         17         1    1135    1246    ExpressJet      4268
4  2011    11         15         2    1334    1841   Continental      1561
5  2011     3         24         4    2112    2221   Continental      1533
6  2011     3         18         5    1812    1914   Continental        35
7  2011     6         22         3    1317    1501      American      1534
8  2011    11         15         2    1616    1751    ExpressJet      4559
9  2011    11         29         2    1800    1915   Continental      1145
10 2011     2          4         5    2114    2228   Continental      1533
..  ...   ...        ...       ...     ...     ...           ...       ...
Variables not shown: TailNum (chr), ActualElapsedTime (int), AirTime (int),
  ArrDelay (int), DepDelay (int), Origin (chr), Dest (chr), Distance (int),
  TaxiIn (int), TaxiOut (int), Cancelled (int), CancellationCode (chr),
  Diverted (int)
>
> # All flights that departed before 5am or arrived after 10pm
> filter(hflights, DepTime < 500  | ArrTime > 2200)
Source: local data frame [2,774 x 21]

   Year Month DayofMonth DayOfWeek DepTime ArrTime UniqueCarrier FlightNum
1  2011     8          7         7    2130    2228            OO      5839
2  2011     1         31         1    2110    2203            XE      2024
3  2011     3         11         5    2114    2343            CO       467
4  2011    10         20         4    1801    2229            CO      1524
5  2011     7          7         4    1914    2222            XE      3050
6  2011     1          3         1    2125    2243            CO      1717
7  2011     4         24         7    1951    2319            XE      2094
8  2011    10          5         3    2049    2202            CO      1530
9  2011     7         22         5    2023    2336            XE      2288
10 2011     2         18         5    1928    2201            OO      5816
..  ...   ...        ...       ...     ...     ...           ...       ...
Variables not shown: TailNum (chr), ActualElapsedTime (int), AirTime (int),
  ArrDelay (int), DepDelay (int), Origin (chr), Dest (chr), Distance (int),
  TaxiIn (int), TaxiOut (int), Cancelled (int), CancellationCode (chr),
  Diverted (int)
>
> # All flights that departed late but arrived ahead of schedule
> filter(hflights, DepDelay > 0 & ArrDelay < 0)
Source: local data frame [2,778 x 21]

   Year Month DayofMonth DayOfWeek DepTime ArrTime UniqueCarrier FlightNum
1  2011    12         29         4     832     953            WN       683
2  2011     7         12         2    1603    1657            WN        40
3  2011    12         28         3    1332    1636            CO      1151
4  2011     2         26         6    1538    1951            B6       624
5  2011    12         21         3     914    1038            CO      1257
6  2011    11         11         5     731    1047            CO      1160
7  2011    12         30         5    1944    2045            WN      3499
8  2011     8         24         3     948    1101            OO      2001
9  2011     1         16         7    1541    1701            CO       795
10 2011     3          7         1    1735    2003            CO       667
..  ...   ...        ...       ...     ...     ...           ...       ...
Variables not shown: TailNum (chr), ActualElapsedTime (int), AirTime (int),
  ArrDelay (int), DepDelay (int), Origin (chr), Dest (chr), Distance (int),
  TaxiIn (int), TaxiOut (int), Cancelled (int), CancellationCode (chr),
  Diverted (int)
>
> # All cancelled weekend flights
> filter(hflights, DayOfWeek %in% c(6,7) & Cancelled == 1)
Source: local data frame [55 x 21]

   Year Month DayofMonth DayOfWeek DepTime ArrTime UniqueCarrier FlightNum
1  2011     4         17         7      NA      NA            WN        42
2  2011     2          6         7      NA      NA            XE      2570
3  2011     4          2         6      NA      NA            WN      3823
4  2011     2          6         7      NA      NA            XE      2902
5  2011    10          9         7      NA      NA            XE      4289
6  2011    12         11         7    1303      NA            UA       399
7  2011     8         27         6      NA      NA            CO      1451
8  2011     5          1         7      NA      NA            OO      5814
9  2011    12         31         6      NA      NA            XE      4542
10 2011     3          6         7      NA      NA            XE      2928
..  ...   ...        ...       ...     ...     ...           ...       ...
Variables not shown: TailNum (chr), ActualElapsedTime (int), AirTime (int),
  ArrDelay (int), DepDelay (int), Origin (chr), Dest (chr), Distance (int),
  TaxiIn (int), TaxiOut (int), Cancelled (int), CancellationCode (chr),
  Diverted (int)
>
> # All flights that were cancelled after being delayed
> filter(hflights, DepDelay > 0 & Cancelled == 1)
Source: local data frame [2 x 21]

  Year Month DayofMonth DayOfWeek DepTime ArrTime UniqueCarrier FlightNum
1 2011     9         16         5    1234      NA            OO      2059
2 2011     1         26         3    1926      NA            CO       310
Variables not shown: TailNum (chr), ActualElapsedTime (int), AirTime (int),
  ArrDelay (int), DepDelay (int), Origin (chr), Dest (chr), Distance (int),
  TaxiIn (int), TaxiOut (int), Cancelled (int), CancellationCode (chr),
  Diverted (int)
>
> # Select the flights that had JFK as their destination: c1
> c1 = filter(hflights, Dest == "JFK")
> c1
Source: local data frame [72 x 21]

   Year Month DayofMonth DayOfWeek DepTime ArrTime UniqueCarrier FlightNum
1  2011     2         26         6    1538    1951            B6       624
2  2011     8         17         3     623    1116            B6       620
3  2011     9         23         5     645    1046            B6       620
4  2011     2         23         3    1546    2002            B6       624
5  2011     7         25         1    1759    2307            B6       622
6  2011     8         11         4     627    1040            B6       620
7  2011     8          5         5     627    1058            B6       620
8  2011     6         20         1     656    1108            B6       620
9  2011     1         12         3    1532    1953            B6       624
10 2011     4          8         5    1526    1937            B6       624
..  ...   ...        ...       ...     ...     ...           ...       ...
Variables not shown: TailNum (chr), ActualElapsedTime (int), AirTime (int),
  ArrDelay (int), DepDelay (int), Origin (chr), Dest (chr), Distance (int),
  TaxiIn (int), TaxiOut (int), Cancelled (int), CancellationCode (chr),
  Diverted (int)
>
> # Combine the Year, Month and DayofMonth variables to create a Date column: c2
> c2 = mutate(c1, Date = paste(Year, Month, DayofMonth, sep = "-"))
> c2
Source: local data frame [72 x 22]

   Year Month DayofMonth DayOfWeek DepTime ArrTime UniqueCarrier FlightNum
1  2011     2         26         6    1538    1951            B6       624
2  2011     8         17         3     623    1116            B6       620
3  2011     9         23         5     645    1046            B6       620
4  2011     2         23         3    1546    2002            B6       624
5  2011     7         25         1    1759    2307            B6       622
6  2011     8         11         4     627    1040            B6       620
7  2011     8          5         5     627    1058            B6       620
8  2011     6         20         1     656    1108            B6       620
9  2011     1         12         3    1532    1953            B6       624
10 2011     4          8         5    1526    1937            B6       624
..  ...   ...        ...       ...     ...     ...           ...       ...
Variables not shown: TailNum (chr), ActualElapsedTime (int), AirTime (int),
  ArrDelay (int), DepDelay (int), Origin (chr), Dest (chr), Distance (int),
  TaxiIn (int), TaxiOut (int), Cancelled (int), CancellationCode (chr),
  Diverted (int), Date (chr)
>
> # Print out a selection of columns of c2
> select(c2, Date, DepTime, ArrTime, TailNum)
Source: local data frame [72 x 4]

        Date DepTime ArrTime TailNum
1  2011-2-26    1538    1951  N292JB
2  2011-8-17     623    1116  N516JB
3  2011-9-23     645    1046  N627JB
4  2011-2-23    1546    2002  N318JB
5  2011-7-25    1759    2307  N657JB
6  2011-8-11     627    1040  N639JB
7   2011-8-5     627    1058  N635JB
8  2011-6-20     656    1108  N247JB
9  2011-1-12    1532    1953  N504JB
10  2011-4-8    1526    1937  N316JB
..       ...     ...     ...     ...
# How many weekend flights flew a distance of more than 1000 miles but had a total taxiing time below 15 minutes?
> select(filter(hflights, DayOfWeek %in% c(6,7) & Distance > 1000 & (TaxiIn + TaxiOut)< 15), Distance, TaxiIn,TaxiOut)
Source: local data frame [155 x 3]

   Distance TaxiIn TaxiOut
1      1235      5       7
2      1020      2       6
3      1303      2      12
4      1312      3       6
5      1246      4       7
6      1195      6       7
7      1235      4       7
8      1530      6       8
9      1235      3      10
10     1043      6       8
..      ...    ...     ...
> # Definition of dtc
> dtc <- filter(hflights, Cancelled == 1, !is.na(DepDelay))
>
> # Arrange dtc by departure delays so that the shortest departure delay is at the top of the data set
> arrange(dtc, DepDelay)
Source: local data frame [7 x 21]

  Year Month DayofMonth DayOfWeek DepTime ArrTime UniqueCarrier FlightNum
1 2011     9         29         4    1639      NA            OO      2062
2 2011     4         30         6     612      NA            EV      5386
3 2011    12         25         7    1652      NA            XE      4375
4 2011    12         11         7    1303      NA            UA       399
5 2011     1         26         3    1703      NA            CO       410
6 2011     1         26         3    1926      NA            CO       310
7 2011     9         16         5    1234      NA            OO      2059
Variables not shown: TailNum (chr), ActualElapsedTime (int), AirTime (int),
  ArrDelay (int), DepDelay (int), Origin (chr), Dest (chr), Distance (int),
  TaxiIn (int), TaxiOut (int), Cancelled (int), CancellationCode (chr),
  Diverted (int)
>
> # Arrange dtc so that cancellation reasons are grouped
> arrange(dtc, CancellationCode)
Source: local data frame [7 x 21]

  Year Month DayofMonth DayOfWeek DepTime ArrTime UniqueCarrier FlightNum
1 2011    12         11         7    1303      NA            UA       399
2 2011     4         30         6     612      NA            EV      5386
3 2011    12         25         7    1652      NA            XE      4375
4 2011     9         16         5    1234      NA            OO      2059
5 2011     1         26         3    1926      NA            CO       310
6 2011     9         29         4    1639      NA            OO      2062
7 2011     1         26         3    1703      NA            CO       410
Variables not shown: TailNum (chr), ActualElapsedTime (int), AirTime (int),
  ArrDelay (int), DepDelay (int), Origin (chr), Dest (chr), Distance (int),
  TaxiIn (int), TaxiOut (int), Cancelled (int), CancellationCode (chr),
  Diverted (int)
>
> # Arrange dtc according to carrier and departure delays
> arrange(dtc, UniqueCarrier, DepDelay)
Source: local data frame [7 x 21]

  Year Month DayofMonth DayOfWeek DepTime ArrTime UniqueCarrier FlightNum
1 2011     1         26         3    1703      NA            CO       410
2 2011     1         26         3    1926      NA            CO       310
3 2011     4         30         6     612      NA            EV      5386
4 2011     9         29         4    1639      NA            OO      2062
5 2011     9         16         5    1234      NA            OO      2059
6 2011    12         11         7    1303      NA            UA       399
7 2011    12         25         7    1652      NA            XE      4375
Variables not shown: TailNum (chr), ActualElapsedTime (int), AirTime (int),
  ArrDelay (int), DepDelay (int), Origin (chr), Dest (chr), Distance (int),
  TaxiIn (int), TaxiOut (int), Cancelled (int), CancellationCode (chr),
  Diverted (int)
>
> # Arrange according to carrier and decreasing departure delays
> arrange(hflights, UniqueCarrier, desc(DepDelay))
Source: local data frame [22,751 x 21]

   Year Month DayofMonth DayOfWeek DepTime ArrTime UniqueCarrier FlightNum
1  2011     5         12         4    2158    2301            AA       426
2  2011    11         15         2    1742    1858            AA       458
3  2011    12         17         6    1805    1912            AA      1033
4  2011     6         21         2    1050    1148            AA      1995
5  2011     6         22         3    1317    1501            AA      1534
6  2011    10         13         4    1138    1454            AA      1946
7  2011     3          9         3    2137    2240            AA       653
8  2011     5         20         5    1020    1136            AA      2002
9  2011     3         24         4     821     924            AA      1225
10 2011     5          2         1    2116    2224            AA       426
..  ...   ...        ...       ...     ...     ...           ...       ...
Variables not shown: TailNum (chr), ActualElapsedTime (int), AirTime (int),
  ArrDelay (int), DepDelay (int), Origin (chr), Dest (chr), Distance (int),
  TaxiIn (int), TaxiOut (int), Cancelled (int), CancellationCode (chr),
  Diverted (int)
>
> # Arrange flights by total delay (normal order).
> arrange(hflights, DepDelay + ArrDelay)
Source: local data frame [22,751 x 21]

   Year Month DayofMonth DayOfWeek DepTime ArrTime UniqueCarrier FlightNum
1  2011    12         25         7     741     926            OO      4591
2  2011    12          4         7     759    1014            XE      4455
3  2011     9         10         6    1830    2036            AS       731
4  2011     3          8         2    1037    1437            CO       432
5  2011    10          2         7     939    1055            OO      5166
6  2011     2         14         1    1917    2027            MQ      3328
7  2011     1          3         1    1056    1303            MQ      3796
8  2011     1         11         2    1005    1326            CO      1544
9  2011     9         29         4     938    1057            OO      2040
10 2011     9          2         5    1855    2238            CO      1661
..  ...   ...        ...       ...     ...     ...           ...       ...
Variables not shown: TailNum (chr), ActualElapsedTime (int), AirTime (int),
  ArrDelay (int), DepDelay (int), Origin (chr), Dest (chr), Distance (int),
  TaxiIn (int), TaxiOut (int), Cancelled (int), CancellationCode (chr),
  Diverted (int)
>
> # Keep flights leaving to DFW before 8am and arrange according to decreasing AirTime
> arrange(filter(hflights, Dest == "DFW", DepTime < 800), desc(AirTime) )
Source: local data frame [77 x 21]

   Year Month DayofMonth DayOfWeek DepTime ArrTime UniqueCarrier FlightNum
1  2011    12         13         2     706     824            MQ      3328
2  2011    12          9         5     724     854            CO      1206
3  2011    12         14         3     732     849            XE      4326
4  2011     1         21         5     746     904            OO      1117
5  2011    11          2         3     556     724            MQ      3265
6  2011     8          5         5     559     711            MQ      3265
7  2011    12         13         2     729     845            XE      4326
8  2011     7          1         5     557     703            MQ      3265
9  2011     7          5         2     557     701            MQ      3265
10 2011    11         24         4     601     715            MQ      3265
..  ...   ...        ...       ...     ...     ...           ...       ...
Variables not shown: TailNum (chr), ActualElapsedTime (int), AirTime (int),
  ArrDelay (int), DepDelay (int), Origin (chr), Dest (chr), Distance (int),
  TaxiIn (int), TaxiOut (int), Cancelled (int), CancellationCode (chr),
  Diverted (int)
>
# print a list containing only TailNum of flights that departed too late, sorted by total taxiing time
> select(arrange(filter(hflights, DepDelay > 30), TaxiIn + TaxiOut),TailNum)
Source: local data frame [2,152 x 1]

   TailNum
1   N747SA
2   N630WN
3   N912WN
4   N255WN
5   N711HK
6   N353SW
7   N326SW
8   N636WN
9   N751SW
10  N9222N
..     ...
> # Print out a summary with variables min_dist and max_dist
> summarise(hflights, min_dist = min(Distance), max_dist = max(Distance))
Source: local data frame [1 x 2]

  min_dist max_dist
1       79     3904
>
> # Print out a summary with variable max_div : the longest Distance for diverted flights
> summarise(filter(hflights, Diverted == 1), max_div = max(Distance))
Source: local data frame [1 x 1]

  max_div
1    1428
> temp1 = filter(hflights, !is.na(ArrDelay))
> summarise(temp1, earliest = min(ArrDelay),
    average = mean(ArrDelay), latest = max(ArrDelay), sd = sd(ArrDelay))
Source: local data frame [1 x 4]

  earliest  average latest       sd
1      -57 6.836407    704 30.08375
> temp2 = filter(hflights, !is.na(TaxiIn) & !is.na(TaxiOut))
> summarise(temp2, max_taxi_diff = max(abs(TaxiIn - TaxiOut)))
Source: local data frame [1 x 1]

  max_taxi_diff
1           141
> # hflights is available
>
> # Remove rows that have NA ArrDelay: temp1
> temp1 = filter(hflights, !is.na(ArrDelay))
>
> # Generate summary about ArrDelay column of temp1
> summarise(temp1, earliest = min(ArrDelay),
    average = mean(ArrDelay), latest = max(ArrDelay), sd = sd(ArrDelay))
Source: local data frame [1 x 4]

  earliest  average latest       sd
1      -57 6.836407    704 30.08375
>
> # Keep rows that have no NA TaxiIn and no NA TaxiOut: temp2
> temp2 = filter(hflights, !is.na(TaxiIn) & !is.na(TaxiOut))
>
>
> # Print the maximum taxiing difference of temp2 with summarise()
> summarise(temp2, max_taxi_diff = max(abs(TaxiIn - TaxiOut)))
Source: local data frame [1 x 1]

  max_taxi_diff
1           141
> # Generate summarizing statistics for hflights
> summarise(hflights, n_obs = length(Year),
    n_carrier = length(unique(UniqueCarrier)),
    n_dest = length(unique(Dest)),
    dest100 = Dest[100])
Source: local data frame [1 x 4]

  n_obs n_carrier n_dest dest100
1 22751        15    115     EWR
>
> # Filter hflights to keep all American Airline flights: aa
> aa = filter(hflights, UniqueCarrier == "American")
>
> # Generate summarizing statistics for aa
> summarise(aa, n_flights = length(Year),
    n_canc = length(which(Cancelled==1)),
    p_canc = length(which(Cancelled==1))/length(Cancelled) * 100,
    avg_delay = mean(ArrDelay, na.rm = TRUE))
Source: local data frame [1 x 4]

  n_flights n_canc   p_canc avg_delay
1       315      5 1.587302 -0.116129
> # Generate summarizing statistics for hflights
> summarise(hflights, n_obs = length(Year),
    n_carrier = length(unique(UniqueCarrier)),
    n_dest = length(unique(Dest)),
    dest100 = Dest[100])
Source: local data frame [1 x 4]

  n_obs n_carrier n_dest dest100
1 22751        15    115     EWR
>
> # Filter hflights to keep all American Airline flights: aa
> aa = filter(hflights, UniqueCarrier == "American")
>
> # Generate summarizing statistics for aa
> summarise(aa, n_flights = length(Year),
    n_canc = length(which(Cancelled==1)),
    p_canc = round(length(which(Cancelled==1))/length(Cancelled) * 100,2),
    avg_delay = round(mean(ArrDelay, na.rm = TRUE),2))
Source: local data frame [1 x 4]

  n_flights n_canc p_canc avg_delay
1       315      5   1.59     -0.12
> # Solve the exercise using a combination of dplyr verbs and %>%
> hflights %>%
    filter(Distance / (ActualElapsedTime + 100) * 60 < 105 | Cancelled == 1 | Diverted == 1) %>%
    summarise( n_non = n(),
             p_non = n()/nrow(hflights) * 100 ,
             n_dest = n_distinct(Dest),
             min_dist = min(Distance),
             max_dist = max(Distance))
Source: local data frame [1 x 5]

  n_non   p_non n_dest min_dist max_dist
1  4294 18.8739     84       79     2007
> # Count the number of overnight flights
> hflights %>%
    filter(!is.na(DepTime) & !is.na(ArrTime) & ArrTime < DepTime) %>%
    summarise(n = n())
Source: local data frame [1 x 1]

    n
1 265
Generate a per-carrier summary of hflights with the following variables: n_flights, the number of flights flown by the carrier; n_canc, the number of cancelled flights; p_canc, the percentage of cancelled flights; avg_delay, the average arrival delay of flights whose delay does not equal NA. Next, order the carriers in the summary from low to high by their average arrival delay. Use percentage of flights cancelled to break any ties. Which airline scores best based on these statistics?
Generate a per-day-of-week summary of hflights with the variable avg_taxi, the average total taxiing time. Pipe this summary into an arrange() call such that the day with the highest avg_taxi comes first.
> # Make an ordered per-carrier summary of hflights
> hflights %>%
    group_by(UniqueCarrier) %>%
    summarise(n_flights = n(),
              n_canc = length(which(Cancelled==1)),
              p_canc = n_canc / n_flights * 100,
              avg_delay = mean(ArrDelay, na.rm=TRUE)) %>%
    arrange(avg_delay)
Source: local data frame [15 x 5]

        UniqueCarrier n_flights n_canc     p_canc  avg_delay
1          US_Airways       422      5  1.1848341 -1.0721154
2                Mesa         7      1 14.2857143 -0.8333333
3            American       315      5  1.5873016 -0.1161290
4             AirTran       225      2  0.8888889  0.7117117
5              Alaska        32      0  0.0000000  1.0625000
6            Frontier        79      0  0.0000000  4.0000000
7             JetBlue        72      3  4.1666667  4.0000000
8         Continental      6978     50  0.7165377  6.0759329
9  Atlantic_Southeast       229      7  3.0567686  6.2927928
10             United       194      5  2.5773196  6.5925926
11              Delta       241      5  2.0746888  7.1440678
12          Southwest      4572     74  1.6185477  7.5294903
13         ExpressJet      7325    112  1.5290102  7.6131367
14     American_Eagle       441      8  1.8140590  7.8101852
15            SkyWest      1619     26  1.6059296  9.1620429
>
> # Make an ordered per-day summary of hflights
> hflights %>%
    group_by(DayOfWeek) %>%
    summarise(avg_taxi = mean(TaxiIn + TaxiOut, na.rm = TRUE)) %>%
    arrange(desc(avg_taxi))
Source: local data frame [7 x 2]

  DayOfWeek avg_taxi
1         1 21.61392
2         5 21.39562
3         2 21.28001
4         3 21.23543
5         4 21.16079
6         7 20.78389
7         6 20.68192
> # Solution to first instruction
> hflights %>%
    filter(!is.na(ArrDelay)) %>%
    group_by(UniqueCarrier) %>%
    summarise(p_delay = length(which(ArrDelay > 0)) / n()) %>%
    mutate(rank = rank(p_delay)) %>%
    arrange(rank)
Source: local data frame [15 x 3]

        UniqueCarrier   p_delay rank
1             AirTran 0.2972973    1
2              Alaska 0.3125000    2
3          US_Airways 0.3149038    3
4             JetBlue 0.3235294    4
5            American 0.3258065    5
6                Mesa 0.3333333    6
7  Atlantic_Southeast 0.3693694    7
8      American_Eagle 0.3750000    8
9               Delta 0.3983051    9
10             United 0.4550265   10
11          Southwest 0.4645003   11
12         ExpressJet 0.4867798   12
13        Continental 0.4937807   13
14           Frontier 0.5063291   14
15            SkyWest 0.5422446   15
>
> # Solution to second instruction
> hflights %>%
    filter(!is.na(ArrDelay) & ArrDelay > 0) %>%
    group_by(UniqueCarrier) %>%
    summarise(avg = mean(ArrDelay)) %>%
    mutate(rank = rank(avg)) %>%
    arrange(rank)
Source: local data frame [15 x 3]

        UniqueCarrier      avg rank
1            Frontier 13.42500    1
2                Mesa 14.00000    2
3          US_Airways 20.19084    3
4         Continental 21.83245    4
5            American 23.07921    5
6          ExpressJet 23.45569    6
7             SkyWest 24.31395    7
8           Southwest 25.18831    8
9             AirTran 26.28788    9
10             United 28.03488   10
11             Alaska 28.30000   11
12              Delta 33.97872   12
13            JetBlue 36.63636   13
14     American_Eagle 39.07407   14
15 Atlantic_Southeast 39.23171   15
> # Which plane (by tail number) flew out of Houston the most times? How many times? adv1
> adv1 <- hflights %>%
          group_by(TailNum) %>%
          summarise(n = n()) %>%
          filter(n == max(n))
> adv1
Source: local data frame [1 x 2]

  TailNum   n
1  N16944 115
> # How many airplanes only flew to one destination from Houston? adv2
> adv2 <- hflights %>%
          group_by(TailNum) %>%
          summarise(ndest = n_distinct(Dest)) %>%
          filter(ndest == 1) %>%
          summarise(nplanes = n())
> adv2
Source: local data frame [1 x 1]

  nplanes
1    1039
>
> # Find the most visited destination for each carrier: adv3
> adv3 <- hflights %>%
          group_by(UniqueCarrier, Dest) %>%
          summarise(n = n()) %>%
          mutate(rank = rank(desc(n))) %>%
          filter(rank == 1)
> adv3
Source: local data frame [15 x 4]
Groups: UniqueCarrier

        UniqueCarrier Dest   n rank
1             AirTran  ATL 211    1
2              Alaska  SEA  32    1
3            American  DFW 186    1
4      American_Eagle  DFW 234    1
5  Atlantic_Southeast  DTW  89    1
6         Continental  LAX 417    1
7               Delta  ATL 219    1
8          ExpressJet  CRP 313    1
9            Frontier  DEN  78    1
10            JetBlue  JFK  72    1
11               Mesa  CLT   6    1
12            SkyWest  COS 143    1
13          Southwest  DAL 839    1
14         US_Airways  CLT 237    1
15             United  ORD  59    1
> # Find the carrier that travels to each destination the most: adv4
> adv4 <- hflights %>%
          group_by(Dest, UniqueCarrier) %>%
          summarise(n = n()) %>%
          mutate(rank = rank(desc(n))) %>%
          filter(rank == 1)
> adv4
Source: local data frame [115 x 4]
Groups: Dest

   Dest UniqueCarrier   n rank
1   ABQ    ExpressJet 109    1
2   AEX    ExpressJet  76    1
3   AMA    ExpressJet 132    1
4   ANC   Continental  18    1
5   ASE       SkyWest   9    1
6   ATL         Delta 219    1
7   AUS   Continental 274    1
8   AVL    ExpressJet  29    1
9   BFL       SkyWest  43    1
10  BHM    ExpressJet 193    1
..  ...           ... ...  ...
> # set up a src that connects to the mysql database (src_mysql is provided by dplyr)
> my_db <- src_mysql(dbname = "dplyr",
                  host = "dplyr.csrrinzqubik.us-east-1.rds.amazonaws.com",
                  port = 3306,
                  user = "dplyr",
                  password = "dplyr")
>
> # and reference a table within that src: nycflights is now available as an R object that references to the remote nycflights table
> nycflights <- tbl(my_db, "dplyr")
>
> # glimpse at nycflights
> glimpse(nycflights)
Observations: 336776
Variables:
$ id        (int) 1, 2, 3, 4, 5, 6, 7, 8, 9, 10, 11, 12, 13, 14, 15, 16, 17...
$ year      (int) 2013, 2013, 2013, 2013, 2013, 2013, 2013, 2013, 2013, 201...
$ month     (int) 1, 1, 1, 1, 1, 1, 1, 1, 1, 1, 1, 1, 1, 1, 1, 1, 1, 1, 1, ...
$ day       (int) 1, 1, 1, 1, 1, 1, 1, 1, 1, 1, 1, 1, 1, 1, 1, 1, 1, 1, 1, ...
$ dep_time  (int) 517, 533, 542, 544, 554, 554, 555, 557, 557, 558, 558, 55...
$ dep_delay (int) 2, 4, 2, -1, -6, -4, -5, -3, -3, -2, -2, -2, -2, -2, -1, ...
$ arr_time  (int) 830, 850, 923, 1004, 812, 740, 913, 709, 838, 753, 849, 8...
$ arr_delay (int) 11, 20, 33, -18, -25, 12, 19, -14, -8, 8, -2, -3, 7, -14,...
$ carrier   (chr) "UA", "UA", "AA", "B6", "DL", "UA", "B6", "EV", "B6", "AA...
$ tailnum   (chr) "N14228", "N24211", "N619AA", "N804JB", "N668DN", "N39463...
$ flight    (int) 1545, 1714, 1141, 725, 461, 1696, 507, 5708, 79, 301, 49,...
$ origin    (chr) "EWR", "LGA", "JFK", "JFK", "LGA", "EWR", "EWR", "LGA", "...
$ dest      (chr) "IAH", "IAH", "MIA", "BQN", "ATL", "ORD", "FLL", "IAD", "...
$ air_time  (int) 227, 227, 160, 183, 116, 150, 158, 53, 140, 138, 149, 158...
$ distance  (int) 1400, 1416, 1089, 1576, 762, 719, 1065, 229, 944, 733, 10...
$ hour      (int) 5, 5, 5, 5, 5, 5, 5, 5, 5, 5, 5, 5, 5, 5, 5, 5, 5, 6, 6, ...
$ minute    (int) 17, 33, 42, 44, 54, 54, 55, 57, 57, 58, 58, 58, 58, 58, 5...
>
>
> # Calculate the grouped summaries detailed in the instructions
>   nycflights %>%
    group_by(carrier) %>%
    summarise(n_flights = n(), avg_delay = mean(arr_delay)) %>%
    arrange(avg_delay)
Source: mysql 5.6.21-log [dplyr@dplyr.csrrinzqubik.us-east-1.rds.amazonaws.com:/dplyr]
From: <derived table> [?? x 3]
Arrange: avg_delay
Warning message: Decimal MySQL column 2 imported as numeric
   carrier n_flights avg_delay
1       AS       714   -9.8613
2       HA       342   -6.9152
3       AA     32729    0.3556
4       DL     48110    1.6289
5       VX      5162    1.7487
6       US     20536    2.0565
7       UA     58665    3.5045
8       9E     18460    6.9135
9       B6     54635    9.3565
10      WN     12275    9.4675
..     ...       ...       ...